

BAND PASS FILTER CIRCUIT SIMULATION - OrCAD 9.2 Software
METHODOLOGY
STEP 01
We were found out theoretical value for Capacitor in High pass Filter Side. (We want to pass 1044Hz frequency) in High pass filter side.
Assumed that both the resistors we have used 10kΩ´s, calculate the values of the two capacitors required.
High Pass Frequency = 1000Hz + 044Hz (Index No) = 1044Hz
The value of the capacitor C1 required to give a cut-off frequency ƒH of 1044 kHz with a resistor value of 10kΩ is calculated as: 𝐶= 12𝜋𝑓𝑅
C = 1 / (2𝜋)(1044) (104)
C = 152.3nF
We were found out theoretical value for Capacitor in Low pass Filter Side. (We want to pass 544 Hz frequency) in Low pass filter side.
Assumed that both the resistors we have used 10kΩ´s, calculate the values of the two capacitors required.
Low Pass Frequency = 500Hz + 044Hz (Index No) = 544Hz
The value of the capacitor C2 required to give a cut-off frequency ƒL of 544 kHz with a resistor value of 10kΩ is calculated as: 𝐶= 12𝜋𝑓𝑅
C = 1 / (2𝜋)(544) (104)
C = 292.4pF
STEP 03
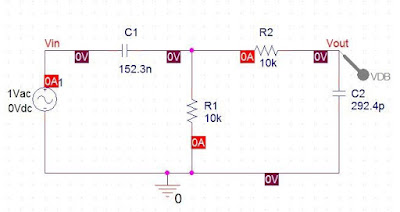
We were draw circuit in ORCAD Capture CIS software.


METHODOLOGY
HIGH PASS FILTER SIDE – CAPACITOR VALUE
STEP 01
We were found out theoretical value for Capacitor in High pass Filter Side. (We want to pass 1044Hz frequency) in High pass filter side.
Assumed that both the resistors we have used 10kΩ´s, calculate the values of the two capacitors required.
High Pass Frequency = 1000Hz + 044Hz (Index No) = 1044Hz
The value of the capacitor C1 required to give a cut-off frequency ƒH of 1044 kHz with a resistor value of 10kΩ is calculated as: 𝐶= 12𝜋𝑓𝑅
C = 1 / (2𝜋)(1044) (104)
C = 152.3nF
LOW PASS FILTER SIDE – CAPACITOR VALUE
STEP 02We were found out theoretical value for Capacitor in Low pass Filter Side. (We want to pass 544 Hz frequency) in Low pass filter side.
Assumed that both the resistors we have used 10kΩ´s, calculate the values of the two capacitors required.
Low Pass Frequency = 500Hz + 044Hz (Index No) = 544Hz
The value of the capacitor C2 required to give a cut-off frequency ƒL of 544 kHz with a resistor value of 10kΩ is calculated as: 𝐶= 12𝜋𝑓𝑅
C = 1 / (2𝜋)(544) (104)
C = 292.4pF
STEP 03
We were draw circuit in ORCAD Capture CIS software.

STEP 04
Then we were used the AC Sweep Type analysis to find the BW (High pass frequency and Low Pass Frequency).

STEP 05
Before, run the simulation, we were put the dB Voltage magnitude probe to the Vout.

STEP 06
After that, we were ran the simulation profile and Adjust the X- axis and Y- axis according to the scales.


STEP 07
Then, we were added the trace for bode plot.

STEP 08
Next, we were marked -3dB point of bode plot with the help of toggle cursor tool.

STEP 09
After that mark the -3dB point coordinate by using mark labels tool.
STEP 10
Finally, took the copy to clip board option for trace bode plot in windows paint and save it as a JPEG File
Author : H.Laahiru Fernando.


No comments:
Post a Comment