

Astable Operation (Astable Multivibrator)


See You with next part.
Laahiru C.Fernando.
Change the Resistor Box Values in Astable Multivibrator
Switch ON the power supply and observed the wave form appeared in the oscilloscope and got the on-time, off time and frequency reading in oscilloscope X axis with uncertainty. The Wave form shown below.

We can calculate theoretical frequency by using below equation,
𝐹𝑟𝑒𝑞𝑢𝑒𝑛𝑐𝑦=1.44(𝑅1+2𝑅2)𝐶
According to the equation theoretically calculated frequency is 480Hz for above observation.
Oscilloscope reading is (4.2±0.1) X0.5ms in X axis.it is T.
𝑓𝑟𝑒𝑞𝑢𝑒𝑛𝑐𝑦=1/𝑇
Actual frequency according to the oscilloscope reading = 1/ T = 1/0.0021 = 476.2Hz.
We can calculate theoretical duty cycle by using below equation,
Duty cycle =1−𝑅2(𝑅1+2𝑅2) 𝑋 100%
According to the equation theoretically duty cycle is 66.67% for above observation.
The resistor Tolerance ± 5 %( Gold)
Actual duty cycle according = 1−1±0.05 𝑋 1000(1±0.05 𝑋 1000+2𝑋 1±0.05 𝑋 1000) 𝑋 (1.2±0.1) X0.5ms(10.0.±0.1) X0.5ms 𝑋100%
The actual duty cycle is ≈2.66%.
The 1kΩ resistors were replaced by using 10 kΩ, 47 kΩ, 100 kΩ and 560 kΩ. After that switch ON the power supply and observed the wave form appeared in the oscilloscope and got the on-time, off time and frequency reading in oscilloscope X axis with uncertainty
According to the practical data, theoretical frequency and actual frequency calculation shown below.

Change the Capacitor Value of the Astable Multivibrator
The 0.1μF Capacitor were replaced by using 0.47μF Capacitor. After that switch ON the power supply and observed the wave form appeared in the oscilloscope and got the on-time, off time and frequency reading in oscilloscope X axis with uncertainty.

According to the practical data, theoretical frequency and actual frequency calculation shown above Table 14: calculated data. We can compare both theoretical value and actual value of frequency. According to the actual frequency is higher than theoretical one. Approximately it is twice of theoretical value. When we increased the resistance frequency will decreased. That mean time delay is increased. We observed it when micro switch pressed LED ON time is increased when increased the resistance. Duty Cycle is Work that capacitor do. It means capacitor charging time. According to the Actual Duty Cycle, when we increased the resistance capacitor charging time will increased.
Plot the graph of ON TIME Vs. Resistance for each Capacitor Values. According to the below table graphs shown below.


Series 1: ON time Vs. Resistance C=0.1μF
Series 2: ON time Vs. Resistance C=0.47μF
According to the Table 15: ON TIME data in 0.47 μF & Table 16: ON TIME data in C=0.1μF major observation is when we increased the resistance ON TIME is increased.
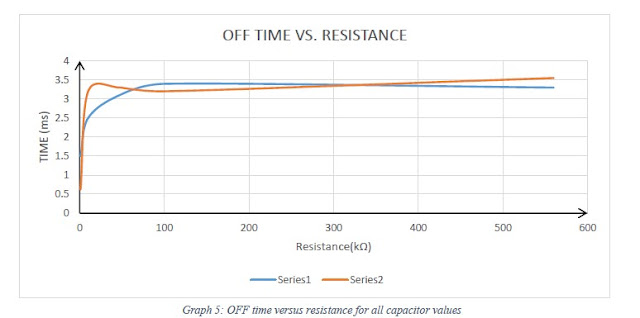
Plot the graph of ON TIME Vs. Resistance for each Capacitor Values. According to the below table graphs shown below.


Series 1: OFF time Vs. Resistance C=0.1μF
Series 2: OFF time Vs. Resistance C=0.47μF
According to the Table 17: OFF TIME data in C=0.47μF & Table 18: OFF TIME data in C=0.1μF the major observation is when we increased the resistance OFF time increased sharply and then increased slightly. If compare both capacitor data of OFF time according to the resistance, when 0.47 μF capacitor function time, OFF time is higher than 0.1 μF capacitor. OFF time mean Capacitor discharging time.
Laahiru C.Fernando.


No comments:
Post a Comment